LBN 1495 in Taurus Molecular Cloud
Images below shows a 6.25° × 4.0° large view of the Taurus Molecular cloud containing LBN 1495.SDSS I'R'G'
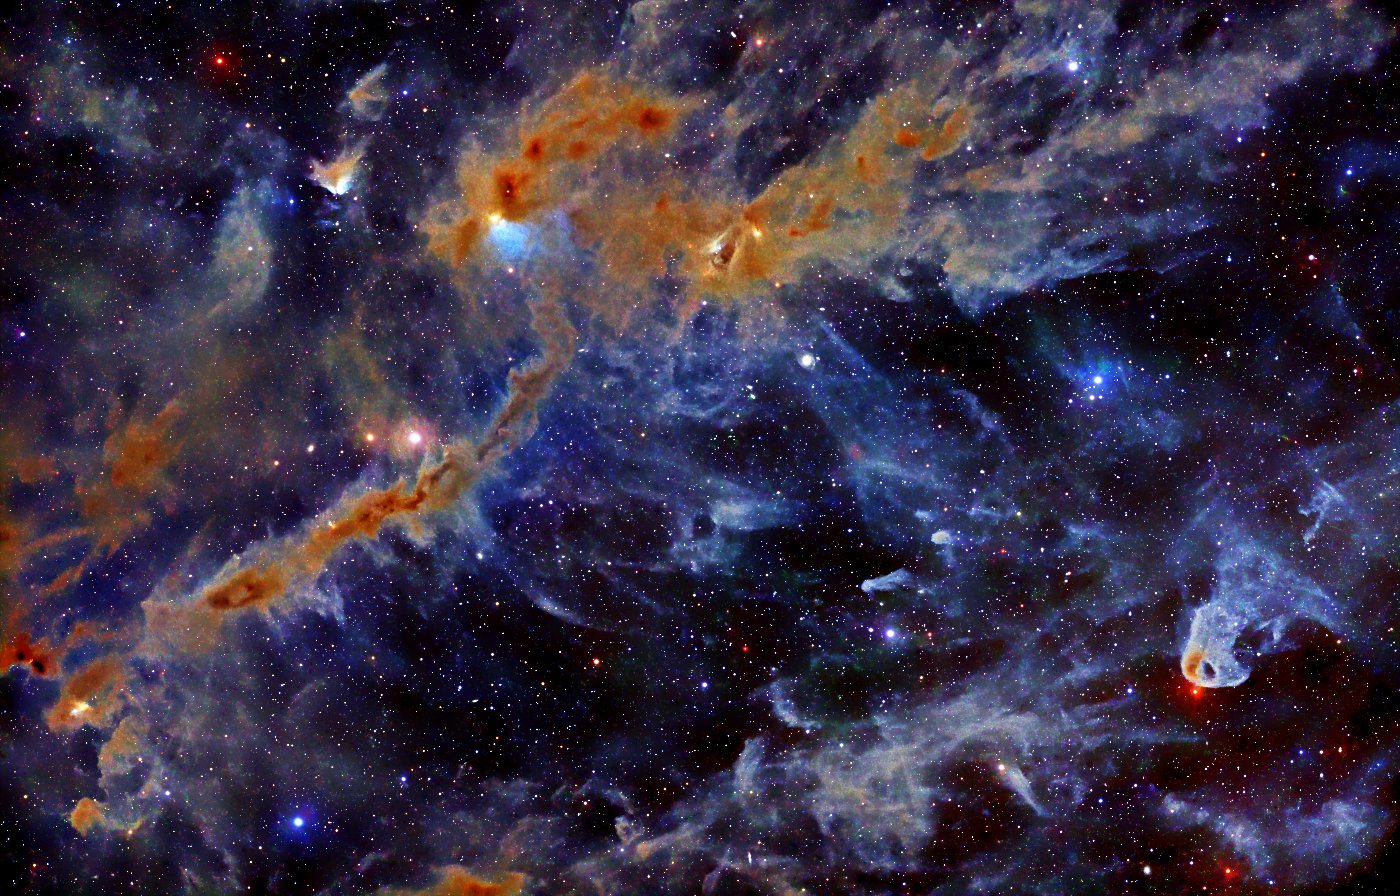
First figure shows a color composite from SDSS I' (mapped to red), R' (mapped green) and G' (mapped blue) filters.
The orange band which stretches from the lower left to the upper right is LBN 1495. That region of dense molecular clouds contains several stellar nurseries.
The small bright nebula which lies in the center of the top left quarter is LBN 785. The bluish region right of it is LBN782. The small spiral galaxy right of the center is IC359.
Toward the lower right there is LBN 777, also known as Baby Eagle Nebula (upside-down).
The stars in the image have been reduced by up to factor of 26 in order to make the faint nebula visible. That caused some artifacts around bright stars.
The color of the nebulae is influenced by scattering which makes dense region more opaque for blue light than for (infra)red radiation.
The contrast between the colors is larger, the larger the bandwidth of the filter set is.
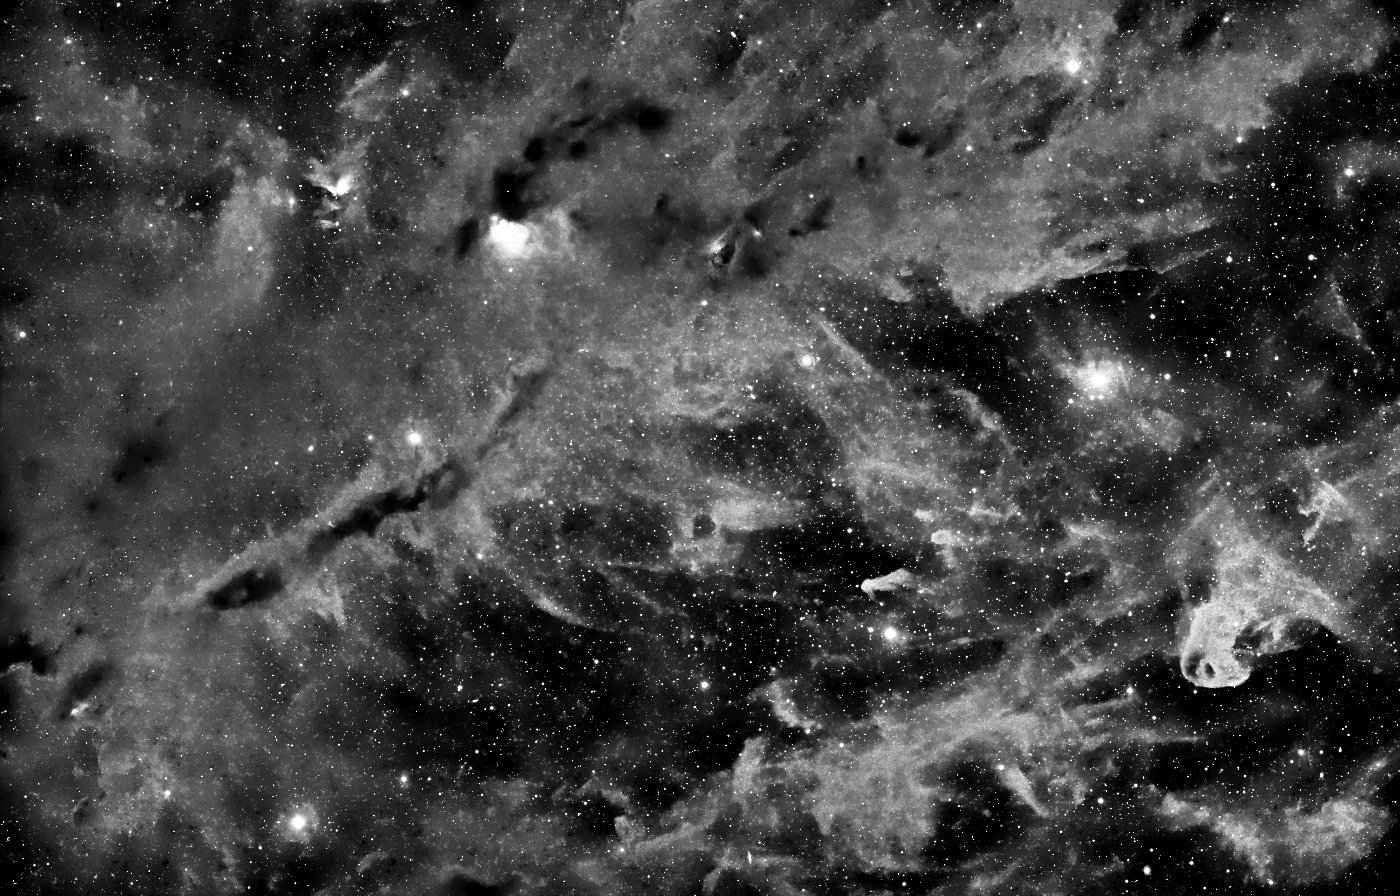
The difference between the color channel is also visualized in the following figure where the color components from the image above can be compared interactively.
Typical RGB filter sets for astronomy only cover the spectral range of the G' and R' filters, about 400nm to 700nm. The bandwidth of on-sensor color filter arrays of consumer cameras is even narrower.
The information contained in the I' channel would be lost with RGB filter.
Especially the denser regions of molecular clouds that absorbs shorter wavelengths are bright in infrared. These nebulae are red or orange in the color composite above. In a RGB images they are dark.
This is also shown in the next figure.
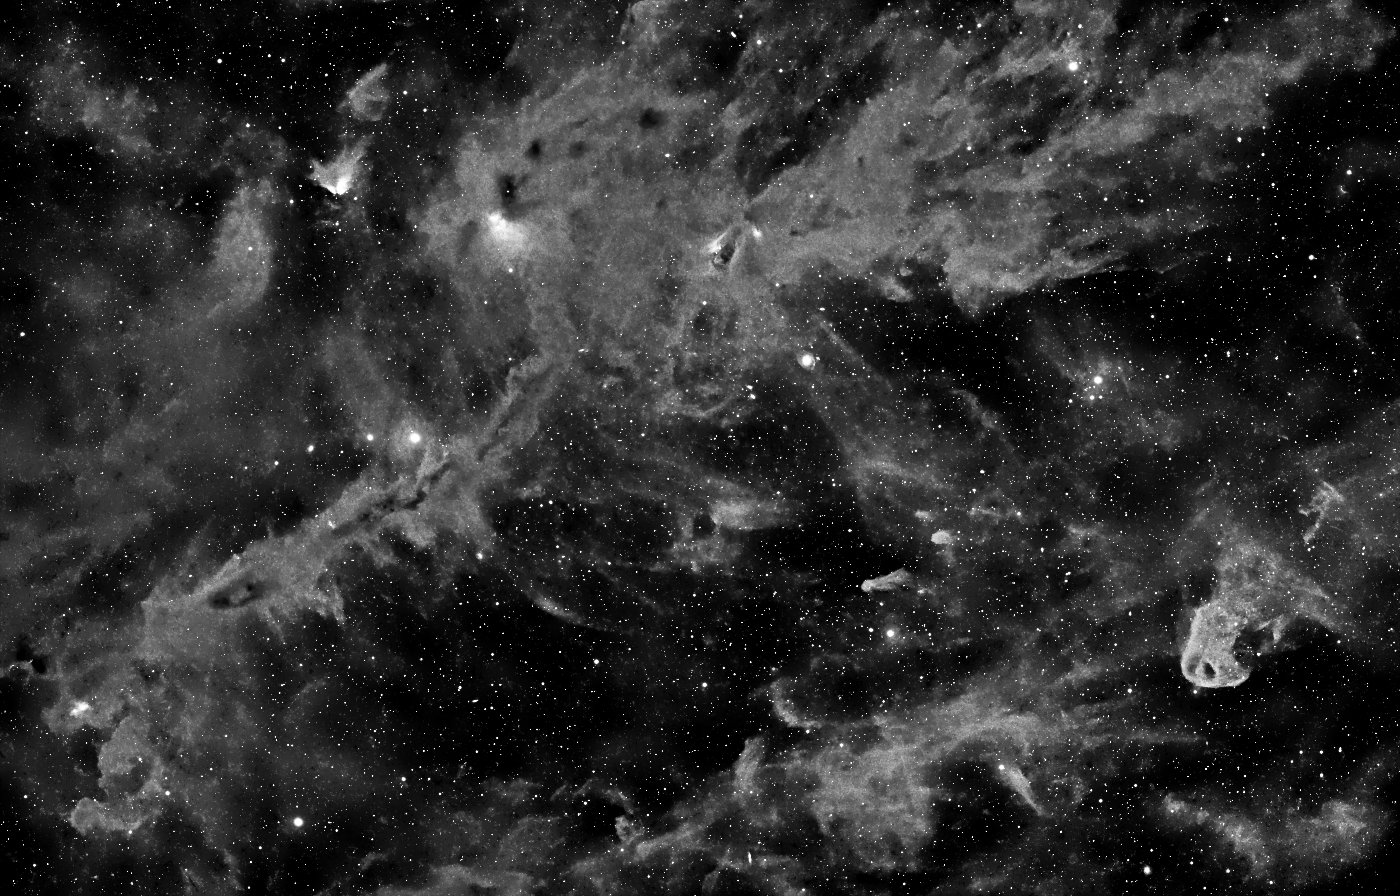
Filter: G'
(requires JavaScript)
RGB comparison
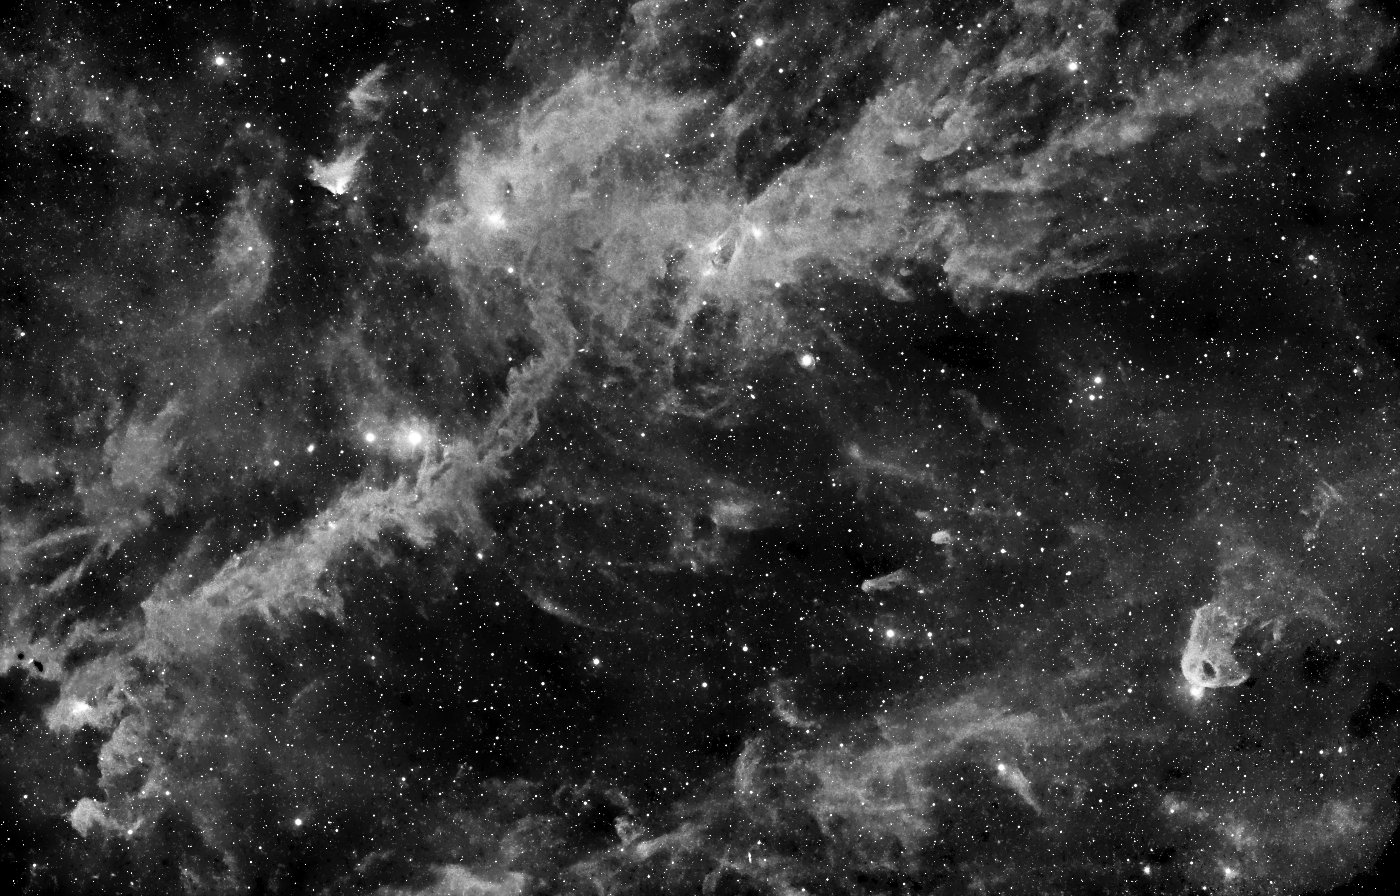
The following pictures are an attempt to compare the results from the SDSS filters with RGB shots.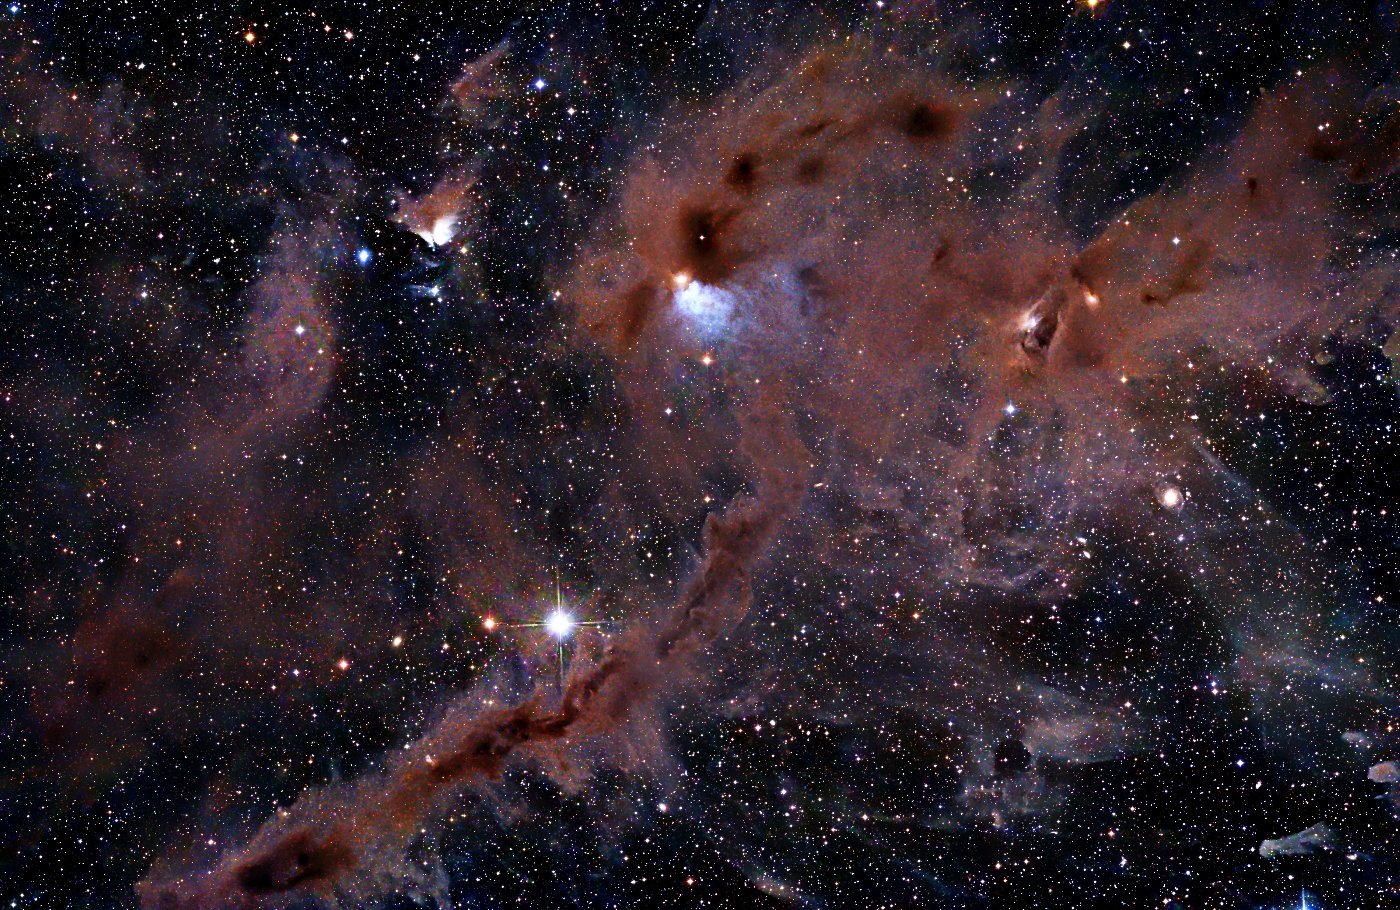
Filters: RGB
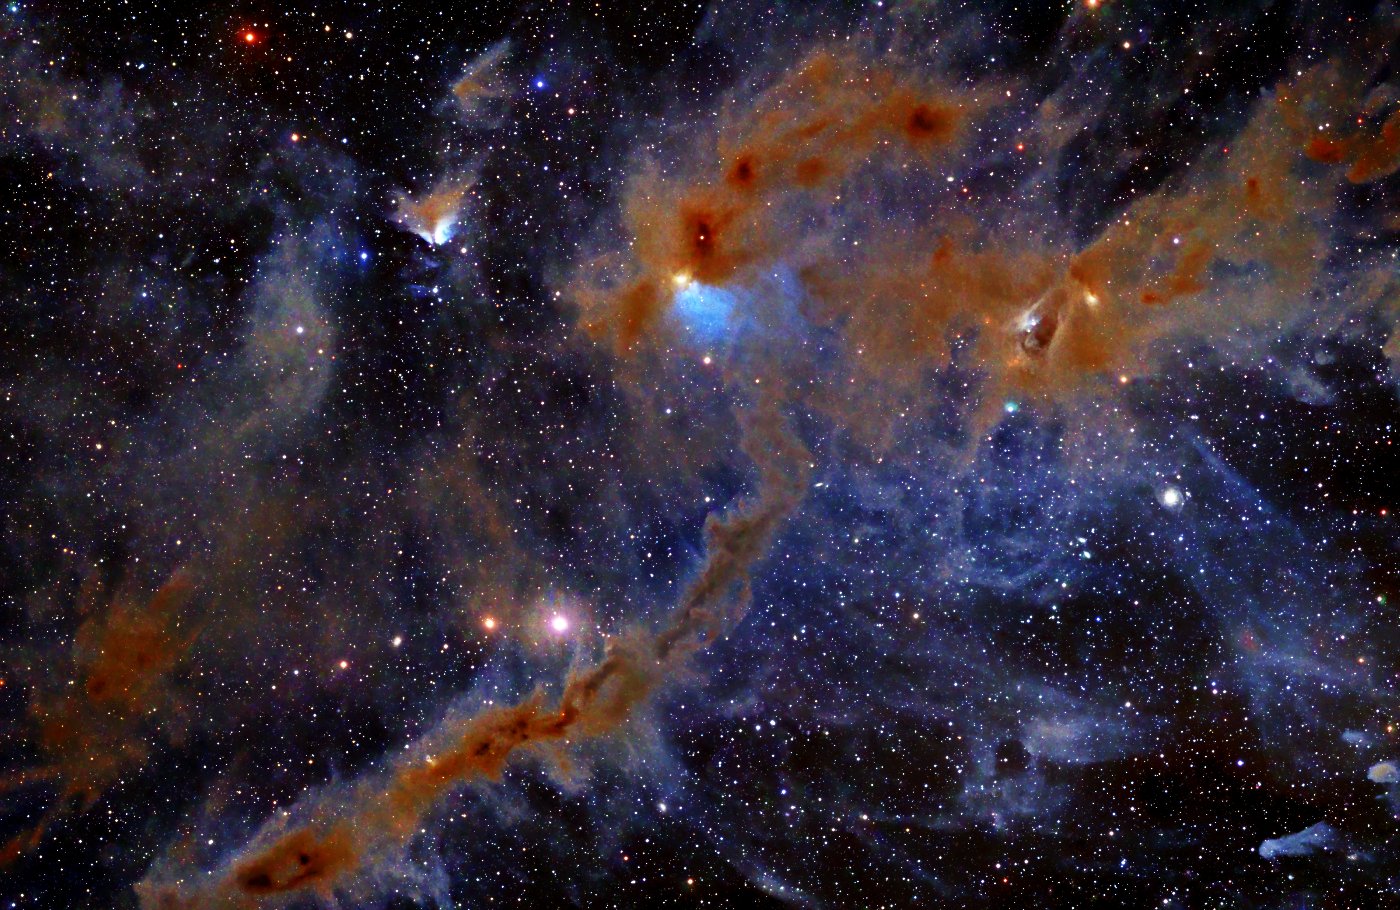
The image shows a 4° × 2.6° large region from the picture from top of this page for which RGB data was available. This data was captured with two D=200mm Newton telescopes and Nikon D800e cameras. The resolution of the larger instrument is higher, but the SNR is lower (despite of the longer total exposure time: 57.8h vs. 20.2h. Reason: The RGB image is a 2×2 mosaic and the sensitivity of the QHY600L with SDSS filters is about 4 times higher than the sensitivity of the Nikon sensor with its filter array).
Due to the lower SNR of the RGB data both images here are a little bit darker than the one at top of this page. It is not possible to produce similar results with both filter sets because nebulae that are dark in RGB are bright in infrared, i.e. red or orange in the I'R'G' composite. That was already shown in previous figure: The Information captured with the I' filter is missing in the RGB variant.
Image data
| FOV: | 6.25° × 4.0° | ||||||
|---|---|---|---|---|---|---|---|
| Date: | 12/2021 to 01/2022 | ||||||
| Location: | Pulsnitz, Germany | ||||||
| Instrument: | 2-3 × Nikon 300mm f/2.8 AF-S | ||||||
| Camera: | 2-3 × QHY600L | ||||||
| Orientation: | North is up (exactly) | ||||||
| Scale: | 3 arcsec/pixel (at full resolution) | ||||||
| Total exposure times: |
|
Image processing
All image processing steps are deterministic, i.e. there was no manual retouching or any other kind of non-reproducible adjustment. The software which was used can be downloaded here.Image processing steps where:
- Bias correction, dark current subtraction, flatfield correction, noise estimation
- Alignment and brightness calibration using stars from reference image
- Stacking with masking unlikely values and background correction
- Star subtraction
- Denoising and deconvolution
- Color composition
- Dynamic range compression using non-linear high-pass filter
- Tonal curve correction